DAVHILL just posted on the Data Action Lab website on how to dynamically change axis text between English and French. This is quite a non-intuitive set of steps requiring some data wrangling but, especially for the GOC is particularly useful in a number of circumstances.
R has become one of the world’s leading languages for statistical and data analysis. While the base R installation does support simple visualizations, its plots are rarely of high-enough quality for publication. Enter Hadley Wickam’s ggplot2, an aesthetically and logical approach to data visualization. In this short report, Ehssan Ghashim and Patrick Boily introduce its graphic grammar elements, and present a number of examples.
DAVHILL just posted a new blog on the Data Action Lab website on how to automatically create a French Translated date from a regular date column in Power BI. This includes a sample data set and the DAX code required to generate the new columns for your visualizations.
DAVHILL just posted a new blog on the Data Action Lab website on how to automatically create a French Translated month from a regular date column in Power BI. This includes a sample data set and the DAX code required to generate the new columns for your visualizations.
The first of the Data Action Lab Data Science Report Series, Ehssan Ghashim and Patrick Boily talk about the use of R.
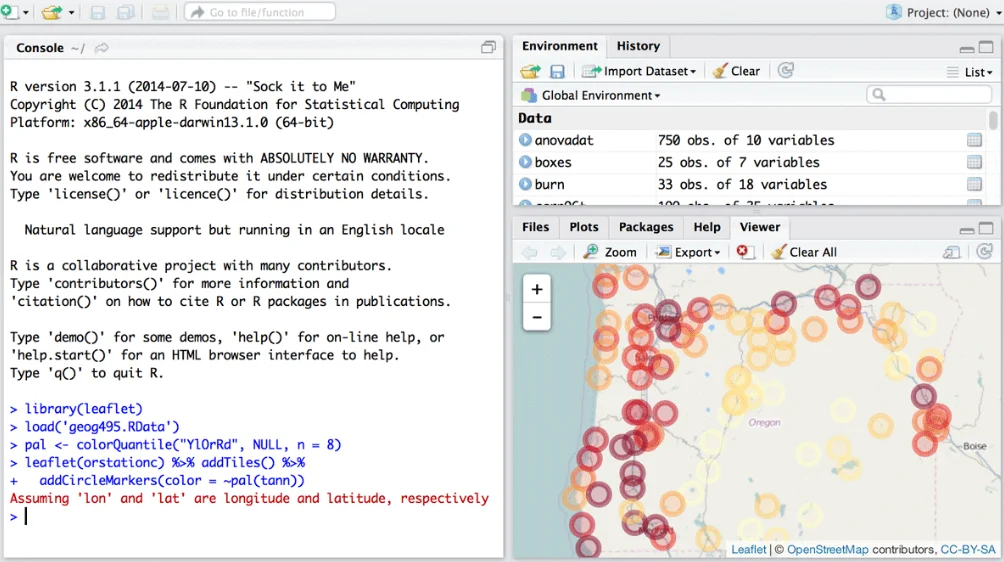
R has become one of the world’s leading languages for statistical and data analysis. In this report, they provide a short description of its core functionality and usage.
DAVHILL just posted a new blog on the Data Action Lab website on how to automatically create a Government of Canada (GOC) Fiscal Month and Fiscal Period . This includes a sample data set and the DAX code required to generate the new columns for your visualizations.
DAVHILL just posted a new blog on the Data Action Lab website on how to automatically convert a date column to a Government of Canada (GOC) fiscal year. This includes a sample data set and the DAX code required to generate the new columns for your visualizations
DAVHILL just posted a new blog on the Data Action Lab website on Minard’s Infamous March to Moscow, frequently identified as the greatest Visualization of all time.