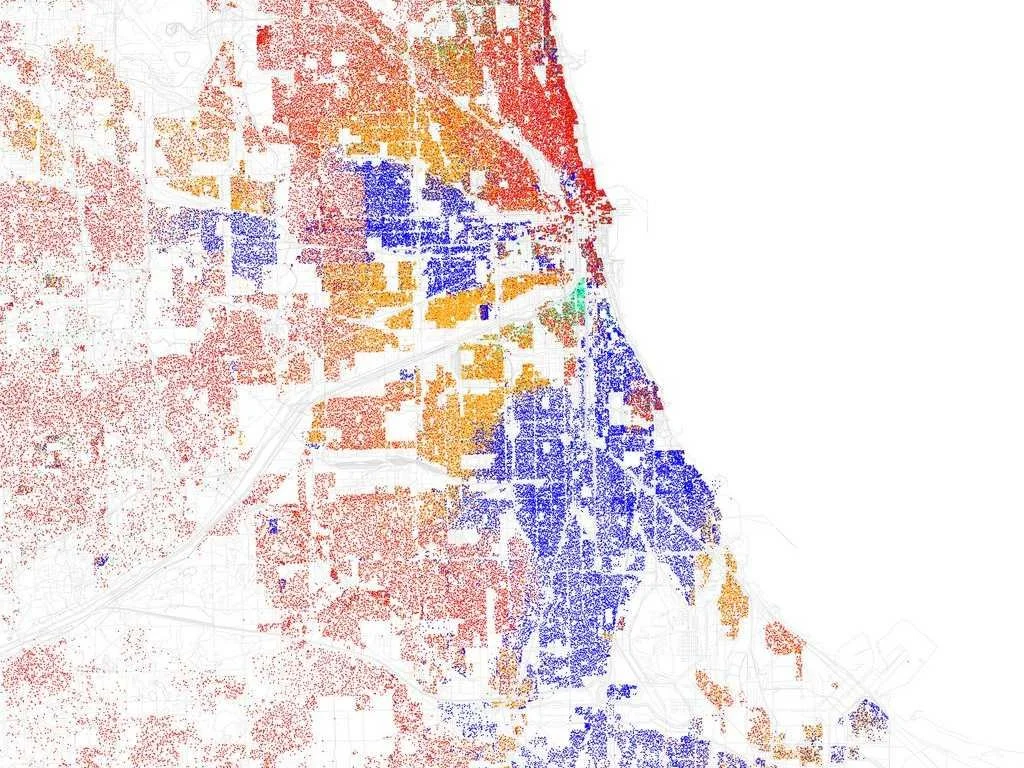
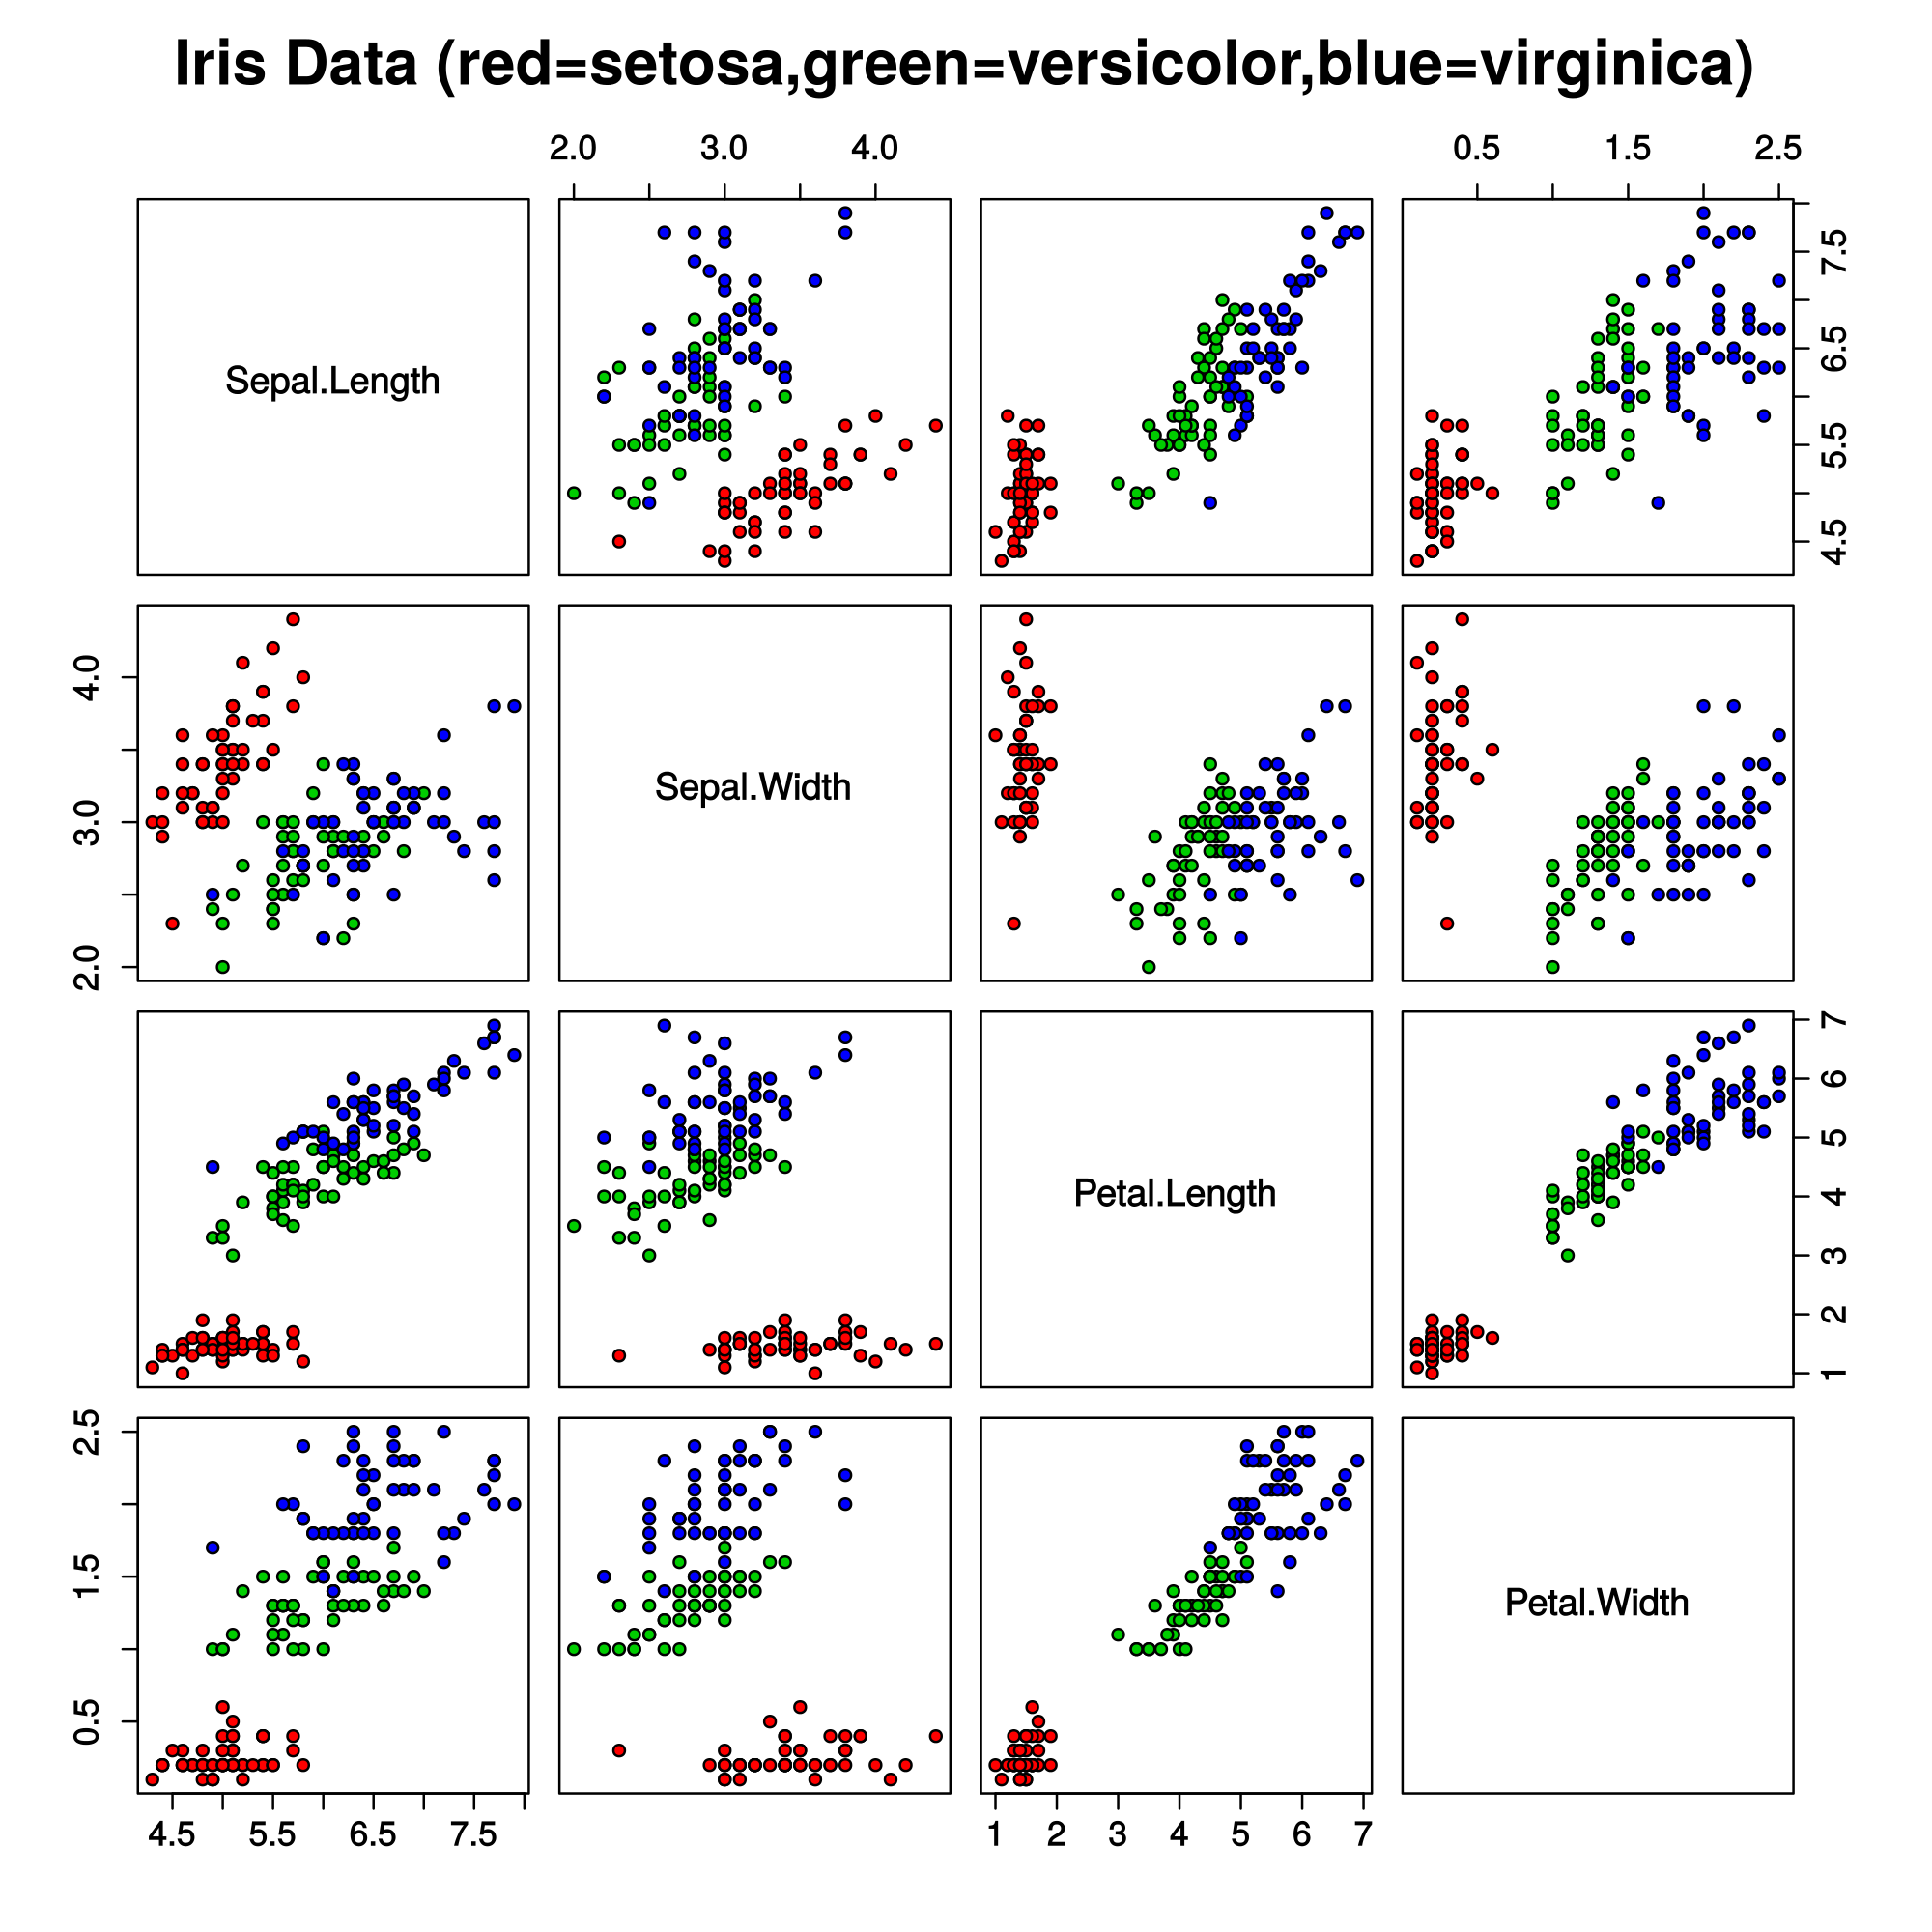
Creating Business Intelligence Visualizations can be quite a challenging task. Working with Business Intelligence tools is not the same as creating charts in a spreadsheet and requires an eye for detail, a detailed knowledge of your end user requirements and the ability to display the information in a simple yet interactive manner that tells a story, not just display data.
DAVHILL Group experts can help you to engage with your end users to design and deploy creative, simple and effective Business Intelligence Visualizations that will enable your organization to make the correct decisions at the right time.
Dashboard development is also key in driving organizational performance. We help you link your Business Intelligence Visualizations with your key business outcomes to give you effective tools to manage ongoing organizational performance.


